

1. Introduction
The change in lifestyle of the world population has meant that people are more predisposed toward the use of natural foods that improve their health, especially in the vegan world, where there is research on bioproducts with high benefits [1]. Numerous natural supplements exploit many metabolites of plant origin. Based on their physiological purpose, the bioactive molecules used vary; vitamins, antioxidants, hormones, polyunsaturated fatty acids, anti-inflammatories and antiproliferative are the most sought after [2]. A healthy and balanced diet, associated with a correct lifestyle, contributes positively to maintaining a state of health [3]. The Mediterranean diet represents an ideal food model, being rich in numerous micro- and macronutrients beneficial to human health. The presence of vegetables, legumes, fruits and olive oil helps to provide all those substances necessary to prevent the development of pathologies strongly conditioned by an incorrect lifestyle [4]. A balanced diet includes low saturated and trans fats, complex carbohydrates and antioxidant molecules [5]. Numerous studies link the intake of bioactive molecules to the reduction of the development of various diseases; for example, it is known that ω-3 fats are cardioprotective and that numerous antioxidant molecules protect against the onset of tumors [6,7,8,9]. Astaxanthin (ASX) (3,3′-dihydroxy-4,4′-dione- β,β′-carotene) is one of the most powerful antioxidants in nature [10]. It belongs to the xanthophyll family, and its chemical formula is C40H55O4, with a molar mass of 596.84 g/mol, and it is a powerful antioxidant thanks to its characteristic chemical structure, which allows it to scavenge reactive oxygen species. The two ketone (-CO) and hydroxyl (-OH) groups at the end of the chain make the antioxidant activity ten times higher than other carotenoids (e.g., β-carotene, lutein and zeaxanthin) and a hundred times more than α-tocopherol [11,12]. Astaxanthin is used in various fields, especially aquaculture, but in recent years, it has also been a food supplement [13,14,15]. Many studies have shown how astaxanthin improves insulin levels and reduces the glucose, tumor necrosis factor-α (TNF-α), total cholesterol, triglycerides, and interleukin-6 (IL-6) levels in the blood of affected people from type 2 diabetes [16,17,18]. Furthermore, astaxanthin prevents the development of cardiovascular diseases, reducing oxidative stress on the blood vessels and, consequently, improving blood fluidity and blood pressure [19,20]. Astaxanthin can exist in three different optical isomers: (3S, 3’S) (3R, 3’R) and (3R, 3’S), but the one that shows the highest antioxidant activity is (3S, 3’S); for this reason, the chemical synthesis of astaxanthin, although cheaper, is not used in the human environment, because natural astaxanthin is stabler, safer and more efficient, as it exists in the two most active forms: (3S, 3’S) and (3R, 3’R) [21]. Many studies have demonstrated how the production of astaxanthin by microorganisms—not only microalgae but also fungi and bacteria [22]—has a positive effect on the world market: production is fast, low-cost substrates (for example, wastewater) can be used as growth media and the extraction does not require toxic reagents that negatively impact the ecosystem [23]. Its recruitment is finely regulated by world agencies. The European Food Safety Authority suggest an acceptable daily intake equal to 0.034 mg/kg BW [24], while the U.S. Food and Drug Administration (FDA) accept 6/7 mg/day [25]. The principal producer of astaxanthin in nature is the green microalga Haematococcus pluvialis (H. pluvialis), belonging to the Chlorophyceae family. H. pluvialis is characterized by the high production of astaxanthin, which varies from 5% to 7% of the dry weight based on culture conditions and by the presence of highly interesting protein and fatty acids [26,27]. Usually, H. pluvialis, as other microalgae, are wild, isolated and not suitable for intensive biomass production; in fact, many studies have focused on their genetic modification to improve the growth rate or metabolites production. The most used methodology for mutagenesis is genetic engineering through plasmidic vectors, which transfer in the microalgae exogen genes derived also from other microorganisms to use microalgae as a reactor [28,29]. Furthermore, H. pluvialis has double phases of growth, green and red. In the green stage, the cells grow and divide until, following stress, they encyst and increase the production of carotenoids, including astaxanthin, which migrates from the center of the cell to the cell walls inside lipid granules to protect the cell [30]. H. pluvialis usually accumulates astaxanthin in the red phase [31]; it is possible to extract it by various chemical–physical procedures, such as chemical solvents or enzymatic treatments [32]. The biosynthesis of astaxanthin shares the first steps with the biosynthesis of β-carotene, starting by three molecules of isopentenyl pyrophosphate (IPP) transformed at the end in β-carotene through a series of reactions that provide for the desaturation and cyclization of various reaction intermediates [33]. Once β-carotene is formed, the astaxanthin-specific biosynthetic pathway begins. Two 3-hydoxy groups are added to β-carotene through the action of β-carotenoid ketolase (bkt) and β-carotene hydroxylase (CrtR-β). Bkt oxidizes β-carotene to form echinenone; echinenone is converted to canthaxanthin by bkt, followed by the two-step hydroxylation of canthaxanthin, catalyzed by β-carotene hydroxylase (CrtR-β), leading to the formation of astaxanthin [34,35]. It can, therefore, be stated that the gene mainly responsible for astaxanthin biosynthesis is bkt. We have already demonstrated, in a previous work, how, by isolating the encysts through a magnetic field, it was possible to optimize astaxanthin production [36]. However, this study aimed to create new genotypes for the production of astaxanthin, starting from a wild-type strain of H. pluvialis, and to evaluate the presence of astaxanthin in the green stage of growth without the induction of stress.
2. Materials and Methods
2.1. Cell Culture and Growth
The cells (1.47 × 10⁶) of H. pluvialis UTEX 2505 were grown in a self-produced media composed of 0.3 g of Greenhouse Special 20–20–20 (Biogard) powder in 1 L of distilled water (Greenhouse Special powder contains HNO36% (w/v), NH4 + 5.2% (w/v), CH4N2O 8.8% (w/v), P2O5 20% (w/v), K2O 20% (w/v), B 0.05% (w/v), Cu 0.01% (w/v), Fe 0.2% (w/v), Mn 0.1% (w/v), Mo 0.005% (w/v), Zn 0.01% (w/v) and chelating agent EDTA) under a light intensity of 120 mmol photons m−2s−1 in a 12 h:12 h light/dark cycle at 25 °C. Cultures were not supplied with an extra source of CO2 and were shaken by a mechanical agitator (g24 environmental incubator shaker, American Laboratory Trading) at 70 rpm. Cell growth was followed through a spectrophotometric analysis by measuring the optical density at 750 nm (SPECTROstar® Nano, BMG Labtech) and cell counts by light microscopy Zeiss Axioplan) using a Burker chamber (BLAUBRAND). All experiments were conducted in triplicate.
2.2. Mutagenesis
H. pluvialis cells were subjected to a random mutagenesis process through the application of UV rays in a system of glass microcapillaries to obtain better-performing genotypes. An amount (100 µL) of H. pluvialis was put into 1 mL serological pipettes and left under UV light for 15 min. After that, the microalgae were seeded into a petri dish containing self-produced media and let grow for 14 days. Different colonies were selected and transferred into liquid media, but only two strains with the best biometric parameters were selected for further analysis (HM1001 and HM1010). Mutant strain growth was followed as described in Section 2.1.
2.3. Genetic Distances
Random Amplification of Polymorphic DNA PCR (RANDOM PRC) was conducted on the mutant strains and wild-type (WT) species to assess the genetic mutation induced by UV and to determine the genetic distance between them. Phire Plant Direct PCR Master Mix (Thermo Fisher Scientific) was used for the DNA extraction and PCR reaction. Eight random primers (Table 1) were used, and 50 loci were highlighted. Some (1.5%) agarose gel (EMR010001, EuroClone S.p.a. Lot. 468.654) was used to check the reaction. The gel was run using PowerPac 3000, Bio-Rad at 80 V for 1 h. Population Genetic Analysis (POPGENE Version 1.32) software was used to analyze the differences. A dominant parameter was used to obtain the genetic distance (Method UPGMA).
2.4. RNA Extraction and Gene Quantification
On days 0, 1, 5, 12, 20 and 25, the RNA from each culture was extracted with NucleoZOL reagent (Macherey-Naghel) following the manufacturer’s recommendations. The RNA was quantified using a NanoDrop™ 1000 spectrophotometer (NanoDrop Technologies, Inc., Wilmington, DE, USA). RNA was retrotranscribed in cDNA using FIRE Script® RT cDNA synthesis Mix (Solis Biodyne) and used at a final concentration of 10 ng. For the qPCR assay, Power SYBR Green PCR Master Mix (Applied Biosystems®, Waltham, MA, USA) was used in the following volumes: 5 μL of Power SYBR-Green PCR Master Mix (10X), 1.5 μL of Forward Primer 10 mM, 1.5 μL of Reverse Primer 10 mM and 1 μL of the template. The protocol was: (1) Holding Stage: 95 °C/10 min; (2) Cycling Stage: 40 cycles of 95 °C/15 s, 60 °C/1 min and 72 °C/1 min and (3) Melt Curve Stage: 95 °C/15 s, 60 °C/1 min, 95 °C/30 s and 60 °C/15 s. The 7500 Fast Real-Time PCR System (Applied Biosystems) and 7500 Software v2.3 (Applied Biosystems) were employed. The real-time PCR primers were the following: 5′-GCATCACAACTTCACTGGGT-3’ and 5′-AGGAAGAAGGGGTATGCG-3’ (BKT); 5′-AGAAGGCTGGGGCTCATTTG-3’ and 5′-AGGGGCCATCCACAGTCTTC-3’ (GAPDH). The relative expression level of bkt mRNA was normalized by the expression of housekeeping GAPDH mRNA in each sample. The ΔCt (cycle threshold) values were obtained by:
ΔCt = Ct target gene − Ct GAPDH.
The 2−ΔΔCt method was used for data analysis, and the cultures not stressed were used as the control [37].
2.5. Astaxanthin Quantification
Some (4.5 × 10⁵) cells (mL−1) of each culture were grown for 7 days in 25 mL of media, and after that, the cells were stressed with 1% of NaCl. The chlorophylls (Chl a and Chl b) and carotenoids were determined through a photometrical assay. Following the Boussiba and Vonshak 1991 protocol [38], at days 0 (stress induction), 7 and 14 (after stress induction), 1 mL of culture (9.33 × 10⁶ cells) was centrifuged for 5 min at 18,000× g. The pellet was resuspended in 1 mL of DMSO. The mixture was heated for 10 min at 70 °C. Extraction was repeated until a colorless pellet was obtained. On the supernatant, the optical density was determined at 649 nm, 665 nm and 480 nm. The amount of carotenoid (μg/mL), including astaxanthin, was calculated according to Wellburn 1994 [39].
Chl a = 12.19 A665 − 3.45 A649
Chl b = 21.99 A649 − 5.32 A665
Carotenoids = (1000A480 − 2.14 Chl a − 70.16 Chl b)/220
For the mutant HM1010, we analyzed the astaxanthin by using Reverse-Phase High-Performance Liquid Chromatography (RP-HPLC)—UV Varian Prostar. Some (10 mL) culture (5.6 × 10⁶ cells mL−1) of HM1010 was not stressed culture and, after 14 days of stress induction, were diluted 100 times (DF100) and extracted in a methanol solution. No purification or extraction was applied. Samples were loaded into an eclipse C18 column and eluted isocratically with 100% methanol solution (20 μL loop). The wavelength used was 450 nm. The reaction was calibrated with the astaxanthin standard (Abcam_AB144193) at 1, 5 and 10 mg/L in methanol.
2.6. Statistical Analysis
The results were analyzed with Microsoft Excel 2016 (Microsoft, Redmond, WA, USA) and GraphPad Prism 8.0.2 (San Diego, CA, USA). Each experiment was performed 3 times for all the analyses. Descriptive statistics were performed to calculate the mean and standard error of the mean (SEM). Two-way ANOVA was performed for the gene expression analysis. p < 0.05 was considered significant.
3. Results
Following the UV-induced random mutagenesis, the growth of the WT genotype and the mutant strains was simultaneously followed to evaluate the adaptive differences in the growth medium. Figure 1 shows how the two mutant strains and the WT grew differently in the self-cultured medium. In particular, the mutant strain HM1001 on day 12 reached a plateau phase, while the mutant strain HM1010 on day 14 was still growing.
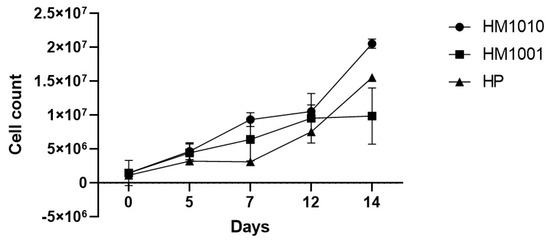
Figure 1. Cell growth. Data are reported as mean ± SEM.
These results demonstrate that UV radiations have created variations inside the cell regarding the adaptive response and the production of biomass and cell growth. Genomic modifications are highlighted by the genetic analysis carried out (Figure 2), which shows how the mutant strains diversified from the wild-type strain (Table 2). In particular, the mutant strain HM1010 shows a valued genetic distance equal to D = 0.9676 from the WT and D = 1.0217 from the mutant strain HM1001, which, on the other hand, is grouped into a single cluster together with the WT strain.
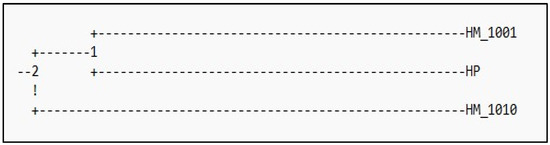
Figure 2. Dendrogram generated by PopGene software.
The preliminary results of the spectrophotometric analysis aimed at reevaluating the trend of the carotenoid pathway and, indirectly, of astaxanthin show an increased production in all cultures in response to saline stress. Figure 3c shows that, on day fourteen, all strains produced quantities of astaxanthin higher than on day 0; however, the HM1010 mutant reached the highest values (17.855 ± 0.998) compared to the WT (9.568 ± 0.432). On the other hand, the chlorophylls showed different trends between all the strains, but all of them decreased their production, entering the cells in a cystic phase and slowing down their metabolism.
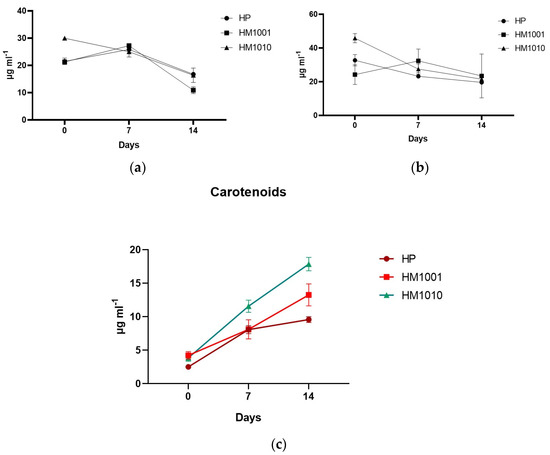
Figure 3. (a) Chlorophyll-a; (b) Chlorophyll-b; (c) Carotenoids in red phase cultures. Data are reported as the mean ± SEM.
The genetic analysis of bkt expression confirmed the spectrophotometric data, as all strains showed an increase in gene expression of bkt—HM1010, more than the others (Figure 4a). To normalize the gene expression, we used unstressed cell cultures; however, the results obtained were interesting, as we found that the HM1010 mutant showed high levels of bkt expression even in the green phase (Figure 4b). The analysis of variance (ANOVA) shown p < 0.01 between the three groups and p = 0.004 between each point in the analysis.
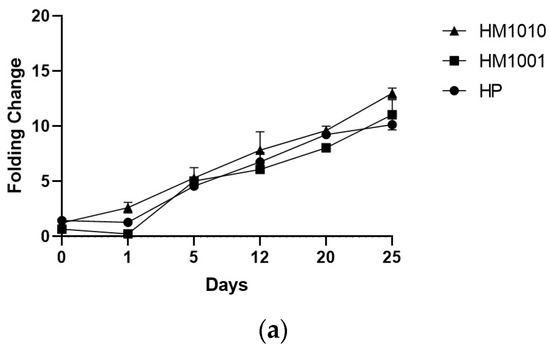
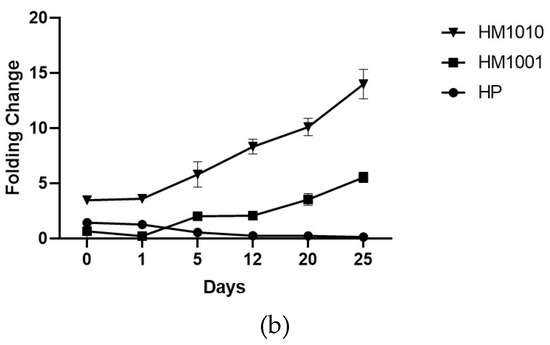
Figure 4. Gene expression in (a) red phase and (b) green phase cultures.
We performed a quantification by mass HPLC only for the HM1010 mutant in both the green and red phases to investigate if the expression of bkt was linked to the production of astaxanthin and not of other carotenoids. The results showed that, in the red phase, the amount of astaxanthin was equal to 120 mg/L, while, in the green, it was 550 mg/L (Figure 5).
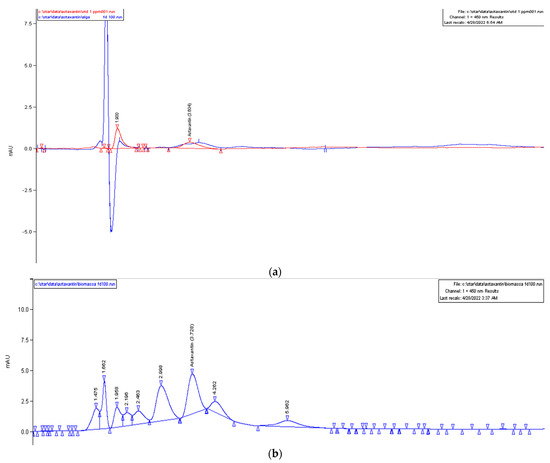
Figure 5. HPLC chromatograms of ASX amount in (a) the red microalgae phase (in red, the ASX standard, and, in blue, the sample analyzed) and (b) green microalgae phase.
4. Discussion and Conclusions
Body and health care affect an increasingly large portion of the world’s population, leading researchers to develop new technologies and products to satisfy the great demand. The attention to the green world and the use of natural methodologies to produce metabolites of interest places microalgae at the center of the scientific discussion as protagonists. Numerous studies have focused on the genetic engineering of microalgae, which insert genes coding for functional enzymes, mainly produced by bacterial and eukaryotic microorganisms, into the algal genome. However, the main changes above all concern the increase in the growth capacity of microalgae, aimed at increasing the production of biomass containing endogenous molecules of high nutraceutical and pharmaceutical interest. This study aimed to evaluate the ability of some H. pluvialis mutants, obtained by random mutagenesis, to produce astaxanthin following stress induction. Random mutagenesis generated several mutant strains, but only two were selected, which showed better bio-physiological characteristics such as growth rate. The HM1001 and HM1010 mutants, genetically different from the WT strain, were found to be excellent producers of astaxanthin compared to the WT, and, in particular, the HM1010 mutant, which not only generates more biomass but produces higher quantities of astaxanthin during the defense process from stress. However, the most interesting results of this research concern the discovery that the HM1010 mutant is capable of producing astaxanthin also in the active phase of growth (green phase), during which the quantities of astaxanthin are even higher than those produced in the red one. These results are also confirmed by the analysis of the gene expression in which the gene responsible for the production of Astaxanthin appears to be more transcribed in the HM1010 mutant than in the HM1001 mutant and in the wild-type strain in the green phase. During its four growth phases, H. pluvialis increases its biomass in the green phase, growing and dividing via asexual reproduction [40]; in the red phase, H. pluvialis is stuck in an encystic stage, which does not allow it to divide and grow optimally. For this reason, the production of astaxanthin is initially linked to obtaining sufficient biomass and subsequently to the induction of stress, light, saline or nutritional deprivation [41], which induces cells to increase the production of astaxanthin [42,43]. Although several studies have shown that astaxanthin production is higher in the red phase than in the green one [40,44]; Ota et al. (2018) suggested that astaxanthin begins to accumulate in lipid microdroplets in the center of the cell already in the green phase and that only after stress-induced stimulation does it migrate towards the cell periphery [45]. We have therefore selected a microalgal genotype of H. pluvialis capable of producing astaxanthin to a greater extent in the green phase. This study represents an excellent starting point in the astaxanthin market as it could avoid production in two different stages and extract astaxanthin directly from the green phase. In this way, there would be a continuous production that does not foresee the stop induced by stress, effectively optimizing the process. Further analyzes of cell lines directed specifically towards different pathophysiological disorders will be performed to strengthen the preliminary results obtained. In conclusion, the HM1010 mutant represents a biotechnological instrument for a production process based on the specific genotype capable of improving the exploitation of a natural resource at an industrial level, obtaining a traceable product, of certain origin given the green and not red color, which could confuse the derivation of astaxanthin with that extracted from crustaceans. In the future, it would be useful to analyze and characterize all the key genes of the pathway of the astaxanthin biosynthesis between the mutant HM1010, the WT, and any other mutants with divergent expression.
Author Contributions
Data curation, G.D.; Formal analysis, R.P.R.; Investigation, A.L.; Methodology, G.M.; Project administration, G.M.; Resources, R.P.R., A.L. and G.D.; Supervision, G.M.; Validation, M.C.P.; Writing—original draft, R.P.R. and Writing—review and editing, M.C.P. All authors have read and agreed to the published version of the manuscript.
Funding
This research received no external funding.
Informed Consent Statement
Not applicable.
Data Availability Statement
Not applicable.
Conflicts of Interest
The authors declare no conflict of interest.